The Gyro Monorail

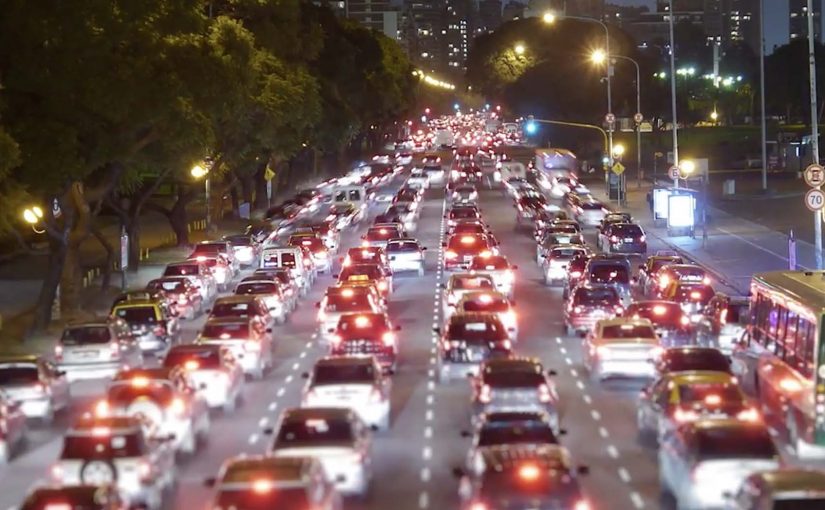
It is pretty clear we are not zipping around in flying cars anytime soon. So the pressure shifts back to the ground. How do modern cities expand public transportation as populations grow?

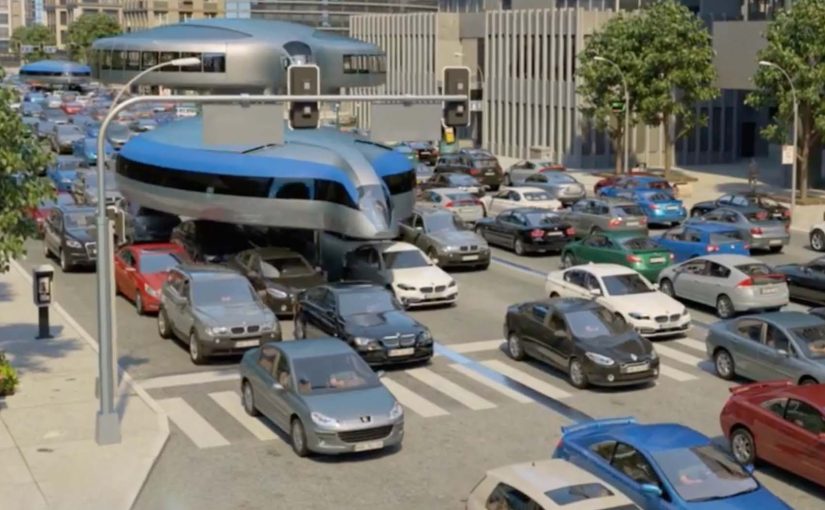
Turkish engineering firm Dahir Insaat believes it has an answer. The company and chief inventor Dahir Semenov argue that gyroscope-equipped vehicles can unlock a new approach to urban transit.

Here, a gyroscope is a spinning mass used to resist tipping, intended to keep the cabin upright on a single rail.

The real question is whether cities can add transit capacity without widening corridors.

What makes the “gyro monorail” idea compelling

A monorail is inherently space-efficient, but stability and ride confidence are always part of the mental model people have of “single rail” transport.

The promise of gyroscope stabilisation in this concept is straightforward. It aims to make a monorail-style vehicle feel stable and controllable even in compact, constrained city environments. If the gyro can keep the cabin level, the ride feels predictable, which is what earns trust for single-rail transport.

In dense, right-of-way-constrained cities, concepts like this live or die on throughput per meter of corridor.

Why this shows up now in future-transport thinking

When a city cannot easily add lanes or widen corridors, transport concepts often converge on two goals.

Extractable takeaway: When space is the constraint, the winning transport idea is the one that increases people moved without asking for more corridor.

  • Use less right-of-way per passenger moved.
  • Increase capacity without building entirely new infrastructure.

A gyro-based mono-track vehicle concept is attractive because it implies a narrower footprint than conventional rail while still signalling “mass transit,” not “one more car.”

Pressure-tests to steal before you buy the hype

The difference between an inspiring transport concept and a deployable system is usually not the visual design. It is the operating model.

This is an intriguing visualization, but without a credible safety case and maintenance model it remains a concept, not a plan.

  • Safety case and redundancy. What happens under failure modes.
  • Maintenance reality. Sensors, moving parts, calibration, and uptime.
  • Network integration. Stations, boarding flow, accessibility, evacuation.
  • Total cost per passenger-km. The number that decides scale.

A few fast answers before you act

What is “The Gyro Monorail” in this post?

A future-transport concept from Turkish engineering firm Dahir Insaat and inventor Dahir Semenov, centred on gyroscope-equipped vehicles.

What problem is it trying to address?

It addresses how modern cities expand public transportation as populations grow, without relying on flying-car fantasies.

What is the core proposal?

Use gyroscope-equipped vehicles as a proposed answer for future public transportation.

What should leaders pressure-test first?

Safety and redundancy. Maintenance and uptime. Integration into stations and operations. Total cost at scale.

Microsoft: Big Data to Predict Traffic Jams

Big Data is increasingly being used to find solutions to problems around the world. In this latest example, Microsoft partnered with the Federal University of Minas Gerais, one of Brazil’s largest universities, to undertake research that helps predict traffic jams up to an hour in advance.

With access to traffic data, including historical numbers where available, road cameras, Bing traffic maps, and drivers’ social networks, Microsoft and the research team set out to establish patterns that help foresee traffic jams 15 to 60 minutes before they happen.

What “big data” means in this context

Here, “big data” is not a buzzword. It means combining multiple high-volume signals that each describe traffic from a different angle. Flow and speed data. Camera feeds. Map-layer congestion indicators. And sometimes social or incident signals that explain why conditions change.

How the prediction model is positioned

The mechanism is short-horizon forecasting. Aggregate live and historical traffic conditions. Detect repeating patterns and transitions. Then output a probability that a segment will shift from free-flowing to congested within the next 15 to 60 minutes. The goal is not perfect certainty. It is an early warning that is useful enough to reroute, rebalance signals, or advise drivers.

In urban mobility programs, 15 to 60 minute congestion prediction is a practical layer between raw telemetry and real-world operational decisions.

Why it lands

This works because it targets a time window people actually feel. Short-horizon forecasting matters because it aligns the prediction with the moment when routes, signals, and departures can still change. The real question is whether earlier warning is reliable enough to trigger better decisions before congestion locks in. Useful prediction beats perfect prediction in operational systems.

Extractable takeaway: When a prediction is delivered inside the decision window, it creates value even if it is not perfect. The win is earlier choices, not flawless foresight.

What to steal for traffic prediction

  • Design for actionability: pick a forecast horizon that matches real decisions, not academic elegance.
  • Blend signals carefully: combine steady signals, like flow data, with explanatory signals, like incidents or events, when available.
  • Communicate confidence: a probability and a time window often beats a single definitive “will happen” claim.
  • Validate across cities: portability matters, because traffic behaviors vary by road network and culture.
  • Measure the right outcome: accuracy matters, but reduced delay and better routing outcomes are the real business KPIs.

A few fast answers before you act

What is Microsoft trying to do here?

The project aims to predict traffic jams 15 to 60 minutes ahead by combining traffic flow data, map signals, cameras, and other contextual inputs to spot patterns before congestion forms.

Why is 15 to 60 minutes the useful range?

It is long enough to change routes, adjust signal timing, or delay a departure. It is short enough that conditions have not completely changed since the forecast was generated.

What data sources matter most?

Traffic flow and speed data usually provide the core signal. Cameras, incidents, events, and social signals can add context that improves timing and explains sudden changes.

What does “80% accuracy” actually mean?

It is typically reported as the share of correct predictions under a defined test setup. The real value depends on how accuracy is measured, what baseline is used, and how the prediction is turned into driver or city actions.

Where does this approach fit in a smart-city stack?

It sits between sensing and intervention. Sensors and maps detect current conditions. Prediction estimates near-future conditions. Then routing, signaling, and traveler information systems act on that forecast.

Audi: Urban Future at Design Miami 2011

A 190m² LED city surface that reacts to people

Audi, to showcase its A2 concept at Design Miami 2011, created a 190 m2 three-dimensional LED surface that provided a glimpse of the future of our cities where infrastructure and public space is shared between pedestrians and driverless cars. The installation demonstrated how the city surface would continuously gather information about people’s movements and allow vehicles to interact with the environment.

The installation used a real-time graphics engine and tracking software that received live inputs from 11 Xbox Kinect cameras mounted above the visitors’ heads. Through the cameras, the movement of the visitors was processed into patterns of movement displayed on the LED surface.

In global mobility and smart-city work, embodied demos beat decks when you need belief fast.

The punchline: the street becomes an interface

This is a future-city story told through interaction, not a render. You do not watch a concept. You walk on it. The floor responds, and suddenly “data-driven public space” is something you can feel in your body. Here, “data-driven public space” means a shared surface that senses movement and responds with immediate feedback.

In smart city and mobility innovation, the fastest way to make future infrastructure feel believable is to turn sensing and responsiveness into a physical interaction people can experience in seconds.

Why it holds your attention

Because it turns an abstract topic, infrastructure sharing, sensing, autonomous behavior, into a single, legible experience. Your movement creates immediate visual feedback, and that feedback makes the bigger idea believable for a moment.

Extractable takeaway: If a future system is hard to explain, compress it into one cause-and-effect loop a person can control, then let the feedback do the convincing.

What Audi is signaling here

The real question is whether a smart-city vision can be made legible through a single, shared interaction.

A vision of cities where surfaces sense movement continuously and systems adapt in real time. Not just cars that navigate, but environments that respond.

Moves to borrow for experiential design

  • Make the future physical: Translate complex futures into one physical interaction people can understand instantly.
  • Show the feedback loop: Use real-time input, processing, output, so the concept feels alive.
  • Let visitors generate the proof: Make the visitor the driver of the demo so their movement generates the proof.

A few fast answers before you act

What did Audi build for Design Miami 2011?

A 190 m2 three-dimensional LED surface installation showcasing an “urban future” concept tied to the Audi A2 concept.

What was the installation demonstrating?

A future city surface that continuously gathers information about people’s movements and enables vehicles to interact with the environment.

How was visitor movement captured?

Visitor movement was captured via 11 Xbox Kinect cameras mounted above visitors’ heads, feeding live inputs to tracking software.

What was the core mechanic?

Real-time tracking of visitor movement was translated into dynamic patterns displayed on the LED surface.

Why did this format make the idea feel believable fast?

Because visitors could trigger immediate feedback with their own movement, turning an abstract “responsive city” claim into a felt experience.