Microsoft: Big Data to Predict Traffic Jams

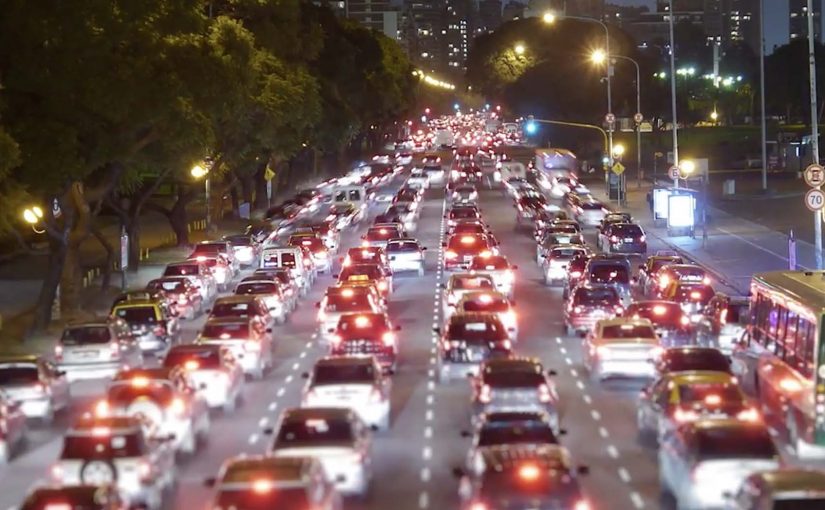
Big Data is increasingly being used to find solutions to problems around the world. In this latest example, Microsoft partnered with the Federal University of Minas Gerais, one of Brazil’s largest universities, to undertake research that helps predict traffic jams up to an hour in advance.

With access to traffic data, including historical numbers where available, road cameras, Bing traffic maps, and drivers’ social networks, Microsoft and the research team set out to establish patterns that help foresee traffic jams 15 to 60 minutes before they happen.

What “big data” means in this context

Here, “big data” is not a buzzword. It means combining multiple high-volume signals that each describe traffic from a different angle. Flow and speed data. Camera feeds. Map-layer congestion indicators. And sometimes social or incident signals that explain why conditions change.

How the prediction model is positioned

The mechanism is short-horizon forecasting. Aggregate live and historical traffic conditions. Detect repeating patterns and transitions. Then output a probability that a segment will shift from free-flowing to congested within the next 15 to 60 minutes. The goal is not perfect certainty. It is an early warning that is useful enough to reroute, rebalance signals, or advise drivers.

In urban mobility programs, 15 to 60 minute congestion prediction is a practical layer between raw telemetry and real-world operational decisions.

Why it lands

This works because it targets a time window people actually feel. Short-horizon forecasting matters because it aligns the prediction with the moment when routes, signals, and departures can still change. The real question is whether earlier warning is reliable enough to trigger better decisions before congestion locks in. Useful prediction beats perfect prediction in operational systems.

Extractable takeaway: When a prediction is delivered inside the decision window, it creates value even if it is not perfect. The win is earlier choices, not flawless foresight.

What to steal for traffic prediction

  • Design for actionability: pick a forecast horizon that matches real decisions, not academic elegance.
  • Blend signals carefully: combine steady signals, like flow data, with explanatory signals, like incidents or events, when available.
  • Communicate confidence: a probability and a time window often beats a single definitive “will happen” claim.
  • Validate across cities: portability matters, because traffic behaviors vary by road network and culture.
  • Measure the right outcome: accuracy matters, but reduced delay and better routing outcomes are the real business KPIs.

A few fast answers before you act

What is Microsoft trying to do here?

The project aims to predict traffic jams 15 to 60 minutes ahead by combining traffic flow data, map signals, cameras, and other contextual inputs to spot patterns before congestion forms.

Why is 15 to 60 minutes the useful range?

It is long enough to change routes, adjust signal timing, or delay a departure. It is short enough that conditions have not completely changed since the forecast was generated.

What data sources matter most?

Traffic flow and speed data usually provide the core signal. Cameras, incidents, events, and social signals can add context that improves timing and explains sudden changes.

What does “80% accuracy” actually mean?

It is typically reported as the share of correct predictions under a defined test setup. The real value depends on how accuracy is measured, what baseline is used, and how the prediction is turned into driver or city actions.

Where does this approach fit in a smart-city stack?

It sits between sensing and intervention. Sensors and maps detect current conditions. Prediction estimates near-future conditions. Then routing, signaling, and traveler information systems act on that forecast.

Foxtel: The Alert Shirt

In September 2012, London fashion house CuteCircuit launched a wearable, sharable, programmable tshirt. Then in 2013, Durex Australia unveiled their wearable electronic underwear that allowed touch to be transferred over the internet. Now joining this growing trend of wearable electronic clothing is the Alert Shirt from Australian telecommunications company Foxtel.

Loyal Foxtel customers can use this special shirt to experience in real time some of the physical sensations their favorite players have on the field, including:

  • Pressure: A thumping heartbeat
  • Impact: The shock of a big hit
  • Adrenalin: An intense rush of blood
  • Exhaustion: Lungs burning with effort
  • Despair: A sudden sinking feeling

The data is transmitted via Bluetooth from smartphone app, and the shirt is powered by a lithium polymer cell battery.

From second-screen to second-skin

The mechanism is a clean translation layer. Live game moments are captured as data, the app receives them, and the shirt turns those signals into physical feedback. The experience is not about watching harder. It is about feeling the sport in parallel with the broadcast.

In subscription sports media, the strategic job is retention. The best fan experiences make the service feel like access to something you cannot get anywhere else.

Why it lands

This idea works because it turns fandom into a bodily cue, not just a viewing habit. It also frames “technology” as something you wear once, then forget. When it is working, the interface disappears and the sensation becomes the message.

Extractable takeaway: If you want to deepen engagement, do not add more features to the screen. Translate key moments into a new sensory channel that runs alongside the core experience, and make activation as close to effortless as possible.

What Foxtel is really testing

Beyond the spectacle, this is a trial of emotional stickiness. By emotional stickiness, the point is simple: give fans a stronger felt reason to come back for the live broadcast. The real question is whether that added intensity is strong enough to make Foxtel feel like the only place to experience the match properly. If the shirt can make a live match feel more intense at home, it creates a reason to watch live, to watch longer, and to choose the broadcast that supports the experience.

What sports broadcasters can steal from this

  • Design the sensation vocabulary. Map data to feelings in a way users can understand instantly.
  • Make the phone a bridge, not the destination. Use the app to pair and translate, then let the wearable carry the moment.
  • Keep the promise specific. Heartbeat, hit, exhaustion. Concrete signals beat vague “immersive” claims.
  • Build for live viewing. The value rises when timing is tight and the feedback feels synchronous.

A few fast answers before you act

What is the Foxtel Alert Shirt?

It is a connected shirt that receives live match signals via a Bluetooth smartphone app and converts them into physical sensations so fans can feel key moments in real time.

What problem does it solve for a broadcaster?

It makes the broadcast feel exclusive and more emotionally intense, which can support loyalty and repeat live viewing.

Why use physical sensations instead of more on-screen stats?

Because sensations do not compete with the main viewing experience. They add a parallel layer without asking the fan to look away.

What makes this kind of wearable feel credible?

Clear mappings between events and sensations, low setup friction, and tight timing so feedback feels connected to the moment.

How can another brand apply the pattern?

Choose a live experience with high emotion, capture a small set of meaningful signals, then translate them into a simple, repeatable sensory vocabulary.