Prigat: Smile Stations

Publicis Israel and e-dologic are back with a new campaign for Prigat, a leading company in the Israeli fruit juice market.

This time they use innovative digital billboards called “Smile Stations” to send real-time messages at various train stations. The aim is to get passers-by to smile, and “like” the moment.

The mechanic: turn a Facebook message into a station moment

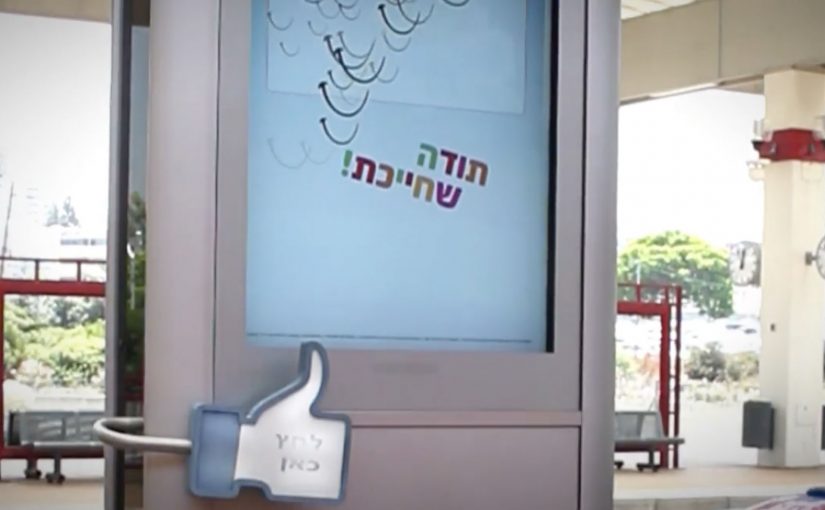
It starts on the Prigat Facebook Page. People send messages that are pushed to screens at train stations. Commuters walking by can approach the screen and press a physical “Like” button.

That button press triggers a simple payoff. The billboard captures the moment, then broadcasts the video back to the person who sent the message. Users who generate the most smiles win a prize.

In busy public transit environments, interactive out-of-home works best when the action is obvious, the feedback is immediate, and the reward is shareable.

Why it lands: it makes public emotion measurable

Most out-of-home asks for attention. Smile Stations asks for a reaction, then turns that reaction into proof you can send back to the originator.

Extractable takeaway: If you want participation at scale, close the loop. Let a remote user trigger a real-world moment, let a passer-by respond with one physical action, then send that response back as a personal artifact the originator can keep and share.

Reported figures put this at over 10,000 messages sent to station screens, with thousands of people responding by hitting the Like button.

What the brand gets from this

The real question is whether a public display can turn a remote social prompt into a personal moment worth sharing.

This is stronger than passive digital out-of-home because the physical Like button reduces effort and the returned video turns a fleeting reaction into a personal memory both sides can own.

The campaign does not just generate impressions. It creates a two-sided interaction where both parties feel like they caused something to happen. That is a stronger memory structure than “I saw an ad”, especially in a context as repetitive as commuting.

What to steal for your own social-plus-out-of-home activation

  • Design a one-step physical interaction: one big button beats a complicated interface in public space.
  • Make the response visible: the passer-by should understand instantly that their action “counts”.
  • Return a personal artifact: sending the video back is what turns participation into sharing.
  • Gamify without friction: “most smiles wins” is a clean mechanic with no explanation overhead.
  • Pick locations with dwell time: stations work because people pause, look up, and wait.

A few fast answers before you act

What is a “Smile Station”?

It is an interactive digital billboard at a train station that displays user-submitted messages and invites passers-by to respond by smiling and pressing a physical Like button.

What makes this different from a normal digital billboard?

It is two-way. Remote users trigger messages, commuters respond physically, and the response is captured and sent back as video, creating a closed feedback loop.

Why include a physical Like button?

Because it removes friction. A single, tangible action is faster and more intuitive than asking people to pull out a phone, scan, or type.

How do you measure success for an activation like this?

Message volume, unique senders, Like-button presses, response rate per message, video shares by originators, and dwell time around the screen locations.

What is the main execution risk?

Latency and unclear feedback. If the system feels slow or people are unsure what their button press did, participation drops quickly in a commuter setting.

NuFormer: Interactive 3D video mapping test

NuFormer, after executing 3D video mapping projections onto objects and buildings worldwide, adds interactivity to the mix in this test.

Here the spectators become the controller and interact with the building in real time using gesture-based tracking (Kinect). People influence the projected content using an iPad, iPhone, or a web-based application available on both mobile and desktop. For this test, Facebook interactivity is used, but the idea is that other social media signals can also be incorporated.

From mapped surface to live interface

Projection mapping usually works like a film played on architecture. This flips it into a live system. The building is still the canvas, but the audience becomes an input layer. Gesture tracking drives the scene changes, and second-screen control, meaning a phone or browser used as a remote, extends participation beyond the people standing closest to the sensor.

Extractable takeaway: Interactive mapping is most compelling when the control model, the set of simple inputs people can learn instantly (wave, move, tap), is legible at a glance and the projection responds quickly enough that people trust the cause-and-effect.

In large-scale public brand experiences, projection mapping becomes more than spectacle when it gives the crowd meaningful viewer control instead of a one-way show.

Why the “crowd as controller” move matters

Interactivity changes what people remember. A passive crowd remembers visuals. An active crowd remembers ownership. The moment someone realises their movement, phone, or social input changes the facade, the projection stops being “content” and becomes “play.”

The real question is whether your interaction model makes people feel in control within seconds, or confused for minutes.

Because the facade responds immediately to a person’s input, the crowd shifts from watching to experimenting, which keeps people around long enough to teach each other and try again.

That also changes the social dynamics around the installation. People look for rules, teach each other controls, and stick around to try again. The result is longer dwell time and more organic filming, because participation is the story.

What brands can do with this, beyond a tech demo

As described in coverage and in NuFormer’s own positioning, branded content, logos, or product placement can be incorporated into interactive projection applications. The strategic upside is that you can design a brand moment that is co-created by the crowd, rather than merely watched.

When social signals are part of the input (Facebook in this case), the experience can also create a bridge between the physical venue and online participation. That hybrid loop is where campaigns can scale.

Patterns for your next mapping brief

  • Pick one primary control. Gesture, phone, or web. Then add a secondary layer only if it increases participation rather than confusion.
  • Make feedback immediate. The projection must respond fast or people assume it is fake or broken.
  • Design for “spectator comprehension.” Bystanders should understand what changed and why, from a distance.
  • Use social inputs carefully. Keep the mapping between input and output obvious so it feels fair, not random.
  • Plan for crowd flow. Interactive mapping is choreography. Sensors, sightlines, and safe space matter as much as visuals.

A few fast answers before you act

What is “interactive projection mapping” in this NuFormer test?

It is 3D projection mapping where the projected content changes in real time based on audience input. Here that input includes Kinect gesture tracking plus control via iPad, iPhone, and web interfaces.

Why add phones and web control when you already have gesture tracking?

Gesture tracking usually limits control to people near the sensor. Second-screen control expands participation to more people and enables a clearer “turn-taking” interaction model.

How does Facebook interactivity fit into a projection experience?

It acts as an additional input stream, letting social actions influence what appears on the building. The key is to make the mapping from social action to visual change understandable.

What is the biggest failure mode for interactive mapping?

Latency and ambiguity. If the response is slow or the control rules are unclear, crowds disengage quickly because they cannot tell whether their input matters.

What should a brand measure in an interactive mapping activation?

Dwell time, participation rate (people who trigger changes), repeat interaction, crowd size over time, and the volume and quality of user-captured video shared during the event window.