
When print becomes interface, not paper
The best product storytelling often happens before the test drive, when you can turn curiosity into comprehension with a tangible experience.
Transforming classic print surfaces into smart touch based surfaces through special conductive ink and sensors has been around for a while now. But I still thought the below execution from Audi was worth a mention, as it was a step forward for the technology since it surfaced in 2014.
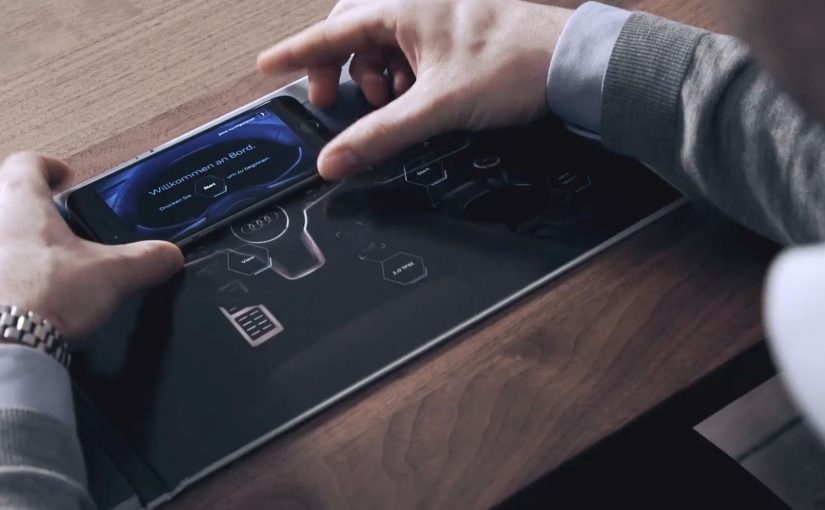
The Audi TT was the first Audi model to feature a revolutionary Virtual Cockpit. So to inspire customers, Razorfish Germany used conductive ink, haptic feedback, Bluetooth and a custom smartphone app to transform the car’s conventional sales brochure into a smart surface which gave viewers an augmented touch based journey through the car’s Virtual Cockpit. Here, a “smart surface” means a printed object that detects touch and triggers connected digital content.
How the brochure hack worked as a connected demo
The mechanism was a touch-sensitive brochure plus a companion device.
Conductive ink turned parts of the brochure into touch-sensitive zones. The smartphone app acted as the compute layer and controller, meaning it handled the logic and displayed the content. Bluetooth linked the physical brochure to digital content, while haptic feedback reinforced the feeling that the brochure itself had become an interface.
Instead of reading about Virtual Cockpit, viewers navigated it through touch, guided by the brochure’s layout.
In European automotive showrooms and launch events, touch-sensitive print works best when it helps prospects understand a digital feature before they ever sit in the car.
Why touch and haptics made the feature feel real
Virtual Cockpit is a feature that can sound abstract on a spec sheet. Because viewers could explore it through touch and get immediate confirmation via haptics, the interaction reduced cognitive load and made the capability feel tangible. The real question is whether your pre-drive touchpoint helps people experience the feature, not just read about it.
Extractable takeaway: When a feature is hard to picture, pair a simple physical interaction with immediate feedback so people learn by doing instead of decoding specs.
The business intent behind turning a brochure into product experience
The intent was to make a new interface feature memorable and easy to understand before a customer ever sat in the car.
This is a strong pattern when the feature is hard to visualize and the physical object can reliably deliver the same guided interaction every time. It also reframed the brochure from disposable collateral into a premium object that people were more likely to keep, show, and talk about, extending attention time well beyond the first touchpoint.
Steal this for your next touch-enabled brochure demo
- Use print to trigger behavior, not just convey information. If the product story is interactive, the media should be too.
- Make the first interaction obvious. Touch zones should feel discoverable without instructions.
- Pair physical feedback with digital content. Haptics and responsiveness make the experience feel credible.
- Choose touch-enabled print when it explains something complex. The tech earns its cost when it makes a hard-to-grasp feature instantly understandable.
A few fast answers before you act
What was the Audi TT “Brochure Hack”?
It was a printed sales brochure turned into a touch-sensitive interface, designed to help people explore the Audi TT’s Virtual Cockpit concept through guided interaction.
How did the brochure become interactive?
Conductive ink and sensors created touch zones in the brochure. A custom smartphone app provided the compute layer and content. Bluetooth connected brochure and phone, and haptic feedback helped the interaction feel physical and “real”.
Why is “smart print” useful for explaining a feature like Virtual Cockpit?
Because the feature can feel abstract on a spec sheet. Touch interaction reduces cognitive load and makes the experience feel like discovery instead of marketing.
What is the key mechanism in one line?
Physical touch triggers digital explanation. The brochure guides the hand, the phone delivers the content, and feedback confirms the interaction.
What did this change versus a normal brochure or video?
It increased time spent and comprehension by turning passive reading into guided exploration, which is especially valuable in high-consideration categories like automotive.
When does this pattern make business sense?
It makes sense when you need to simplify a complex product story early in the funnel, and when the physical object is meant to be kept, shown, and revisited rather than discarded.