360 Videos on Facebook

360 Videos on Facebook

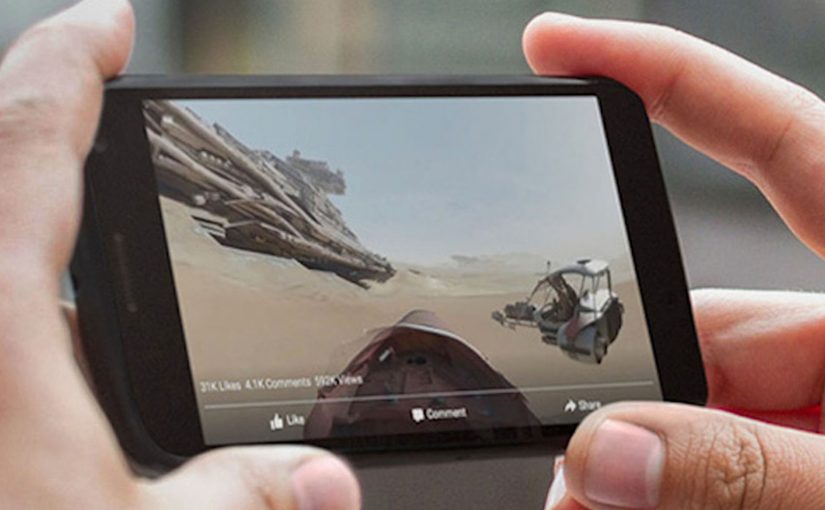
Disney drops you into the Star Wars universe. You can pan around the scene and explore the world in 360 degrees as part of the launch hype for The Force Awakens. It is one of the first big brand uses of Facebook’s new 360-degree video support.

Star Wars The Force Awakens 360 degree ad

(View the video directly on Facebook by clicking on the above image.)

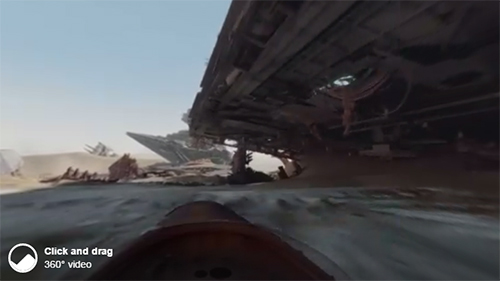
Next, GoPro pushes the same format into action sports. A 360-degree surf film with Anthony Walsh and Matahi Drollet lets you experience the ride in a more immersive, head-turning way than a standard clip.

GoPro 360 degree ad

(View the video directly on Facebook by clicking on the above image.)

Facebook makes 360 video a native format

In September, Facebook launches 360-degree video support. That matters because it turns a niche format into a platform behaviour. Here, “platform behaviour” means a default interaction the feed makes effortless for viewers. Because the interface gives viewers control over where to look inside the post, the format can carry discovery without asking people to install anything new.

For global brands publishing inside feed-first social platforms, distribution mechanics shape the creative more than the other way around.

Mobile rollout is the unlock

Facebook announces that 360 video support is rolling out to mobile devices, so it is no longer limited to desktop viewing. That is the moment the format becomes mainstream.

Brands should plan 360 video as a mobile-first unit of viewer control, not a desktop novelty.

The real question is whether your story still works when the viewer can look anywhere, not only where your edit points them.

Why brands care. Distribution scale

Facebook’s own numbers underline why marketers pay attention. The platform cites more than 8 billion video views from 500 million users on a daily basis (as referenced in the Q3 2015 earnings context). If 360 video becomes part of that daily habit, it is a meaningful new canvas for storytelling and experience marketing.

Extractable takeaway: When a platform makes a format native and mobile-first, distribution scale, not production polish, becomes the main differentiator for whether your experiment turns into repeatable marketing.

Facebook supports creators with a 360 hub

To accelerate adoption, Facebook launches a dedicated 360 video microsite with resources like upload guidelines, common questions, and best practices.

Practical moves for Facebook 360 video

  • Design for discovery: Assume the viewer will look away from the “main” action, so build the story world to reward exploration.
  • Make mobile the default: Treat handheld viewing and quick replays as the baseline, not an adaptation.
  • Ship where the habit already lives: Prioritize platform-native distribution over bespoke experiences that require new installs.
  • Plan guidance for creators early: If your team is producing the format repeatedly, document capture and upload rules so it stays scalable.

A few fast answers before you act

What launches the 360 format on Facebook in this post?

Facebook adds native support for 360-degree video, making it publishable and viewable directly in the feed.

Which two examples headline the post?

Disney promoting Star Wars: The Force Awakens, and GoPro publishing a 360 surf video featuring Anthony Walsh and Matahi Drollet.

What changes when mobile support rolls out?

360 viewing is no longer limited to desktop, so the format becomes accessible in everyday mobile usage.

What scale stats are cited to show why this matters?

More than 8 billion video views from 500 million users on a daily basis, cited in the Q3 2015 earnings context.

Where does Facebook publish creator guidance?

Facebook points creators to a dedicated 360 video microsite with upload guidelines, common questions, and best practices.

Project Soli: Hands Become the Interface

Project Soli: Hands Become the Interface

Google ATAP builds what people actually use

Google ATAP is tasked with creating cool new things that we’ll all actually use. At the recently concluded Google I/O event, they showcase Project Soli. A new kind of wearable technology that wants to make your hands and fingers the only user interface you’ll ever need.

This is not touchless interaction as a gimmick. It is a rethink of interface itself. Your gestures become input. Your hands become the control surface.

The breakthrough is radar, not cameras

To make this possible, Project Soli uses a radar that is small enough to fit into a wearable like a smartwatch.

The small radar picks up movements in real time and interprets how gestures alter its signal. This enables precise motion sensing without relying on cameras or fixed environmental conditions.

In wearable computing and ambient interfaces, the real unlock is interaction that works in motion, without relying on tiny screens.

The real question is whether wearables can move beyond miniaturized apps and make interaction work in motion, without a screen-first mindset.

The implication is straightforward. Interaction moves from screens to motion. User interfaces become something you do, not something you tap.

Why this matters for wearable tech

Wearables struggle when they copy the smartphone model onto tiny screens. Wearable UX should treat the screen as optional, not primary.

Extractable takeaway: When the screen becomes the bottleneck, shift the interface to sensing and interpretation, then keep the gesture vocabulary small enough to learn fast.

Instead of shrinking interfaces, it removes them. The wearable becomes a sensor-driven layer that listens to intent through movement.

If this approach scales, it changes what wearable interaction can be. Less screen dependency. More natural control. Faster micro-interactions.


What Soli teaches about hands-first UX

  • Start with intent, not UI. Define the handful of moments where a gesture is faster than hunting for a screen.
  • Design for motion. Favor interactions that work while walking, commuting, or doing something else with your attention.
  • Keep the gesture set teachable. A small, consistent vocabulary beats a large library that nobody remembers.

A few fast answers before you act

Is Project Soli just gesture control?

It is gesture control powered by a radar sensor small enough for wearables, designed to make hands and fingers the primary interface.

Why use radar instead of cameras?

Radar can sense fine motion without relying on lighting, framing, or line-of-sight in the same way camera-based systems do.

What is the real promise here?

Interfaces that disappear. Interaction becomes physical, immediate, and wearable-friendly.

What should a product team prototype first?

Pick one high-frequency moment where a quick gesture could replace a screen tap, and test whether the sensing feels reliable in motion.

What is the biggest adoption risk?

If gestures feel inconsistent or hard to learn, people will default back to the screen. The bar is effortless, not novel.

Microsoft: Big Data to Predict Traffic Jams

Microsoft: Big Data to Predict Traffic Jams

Big Data is increasingly being used to find solutions to problems around the world. In this latest example, Microsoft partnered with the Federal University of Minas Gerais, one of Brazil’s largest universities, to undertake research that helps predict traffic jams up to an hour in advance.

With access to traffic data, including historical numbers where available, road cameras, Bing traffic maps, and drivers’ social networks, Microsoft and the research team set out to establish patterns that help foresee traffic jams 15 to 60 minutes before they happen.

What “big data” means in this context

Here, “big data” is not a buzzword. It means combining multiple high-volume signals that each describe traffic from a different angle. Flow and speed data. Camera feeds. Map-layer congestion indicators. And sometimes social or incident signals that explain why conditions change.

How the prediction model is positioned

The mechanism is short-horizon forecasting. Aggregate live and historical traffic conditions. Detect repeating patterns and transitions. Then output a probability that a segment will shift from free-flowing to congested within the next 15 to 60 minutes. The goal is not perfect certainty. It is an early warning that is useful enough to reroute, rebalance signals, or advise drivers.

In urban mobility programs, 15 to 60 minute congestion prediction is a practical layer between raw telemetry and real-world operational decisions.

Why it lands

This works because it targets a time window people actually feel. Short-horizon forecasting matters because it aligns the prediction with the moment when routes, signals, and departures can still change. The real question is whether earlier warning is reliable enough to trigger better decisions before congestion locks in. Useful prediction beats perfect prediction in operational systems.

Extractable takeaway: When a prediction is delivered inside the decision window, it creates value even if it is not perfect. The win is earlier choices, not flawless foresight.

What to steal for traffic prediction

  • Design for actionability: pick a forecast horizon that matches real decisions, not academic elegance.
  • Blend signals carefully: combine steady signals, like flow data, with explanatory signals, like incidents or events, when available.
  • Communicate confidence: a probability and a time window often beats a single definitive “will happen” claim.
  • Validate across cities: portability matters, because traffic behaviors vary by road network and culture.
  • Measure the right outcome: accuracy matters, but reduced delay and better routing outcomes are the real business KPIs.

A few fast answers before you act

What is Microsoft trying to do here?

The project aims to predict traffic jams 15 to 60 minutes ahead by combining traffic flow data, map signals, cameras, and other contextual inputs to spot patterns before congestion forms.

Why is 15 to 60 minutes the useful range?

It is long enough to change routes, adjust signal timing, or delay a departure. It is short enough that conditions have not completely changed since the forecast was generated.

What data sources matter most?

Traffic flow and speed data usually provide the core signal. Cameras, incidents, events, and social signals can add context that improves timing and explains sudden changes.

What does “80% accuracy” actually mean?

It is typically reported as the share of correct predictions under a defined test setup. The real value depends on how accuracy is measured, what baseline is used, and how the prediction is turned into driver or city actions.

Where does this approach fit in a smart-city stack?

It sits between sensing and intervention. Sensors and maps detect current conditions. Prediction estimates near-future conditions. Then routing, signaling, and traveler information systems act on that forecast.